
Your personal digital laboratory for all your crops and farm management system
About CropLab
CropLab supports you in achieving exceptional results at every step of the agricultural production cycle
What CropLab Does
CropLab enables farmers and agronomists to access key indicators to monitor the condition of their crops. The main goal of the platform is to guide you towards more efficient use of agricultural resources, resulting in cost savings and increased profitability.
Vision and Mission
We believe in a future where farmers achieve higher yields and better crop quality through production optimization, while also contributing to environmental conservation. Our mission is to provide every farmer with the opportunity to realize the full potential of their farm.
Benefits
More than 10€
Net benefit per hectare
18 - 30%
Reduction in water consumption
2 weeks
Advantage in detecting stressed crops compared to conventional methods
Services
Crop Monitoring
CropLab provides data on 2 biophysical parameters: Normalized Difference Vegetation Index (NDVI) and Chlorophyll Index (CHL).
croplab
croplab
croplab
croplab
croplab
croplab
croplab
Benefits
Through the biophysical parameters that enable an analysis of crop conditions, CropLab provides you with timely information on when to react. One example is the NDVI index, which allows farmers and agronomists to recognize changes in crops up to two weeks before they can be seen with the naked eye.
Managament zones
Management zones represent three areas within a field with (1) average, (2) increased, and (3) decreased productivity (compared to the average productivity of the field). This information is obtained through the analysis of historical satellite data.
croplab
croplab
croplab
croplab
Benefits
This service supports precision farming methods, including optimal soil sampling, efficient use of agricultural inputs (e.g. fertilizers), and various field operations.
Crop stage detection
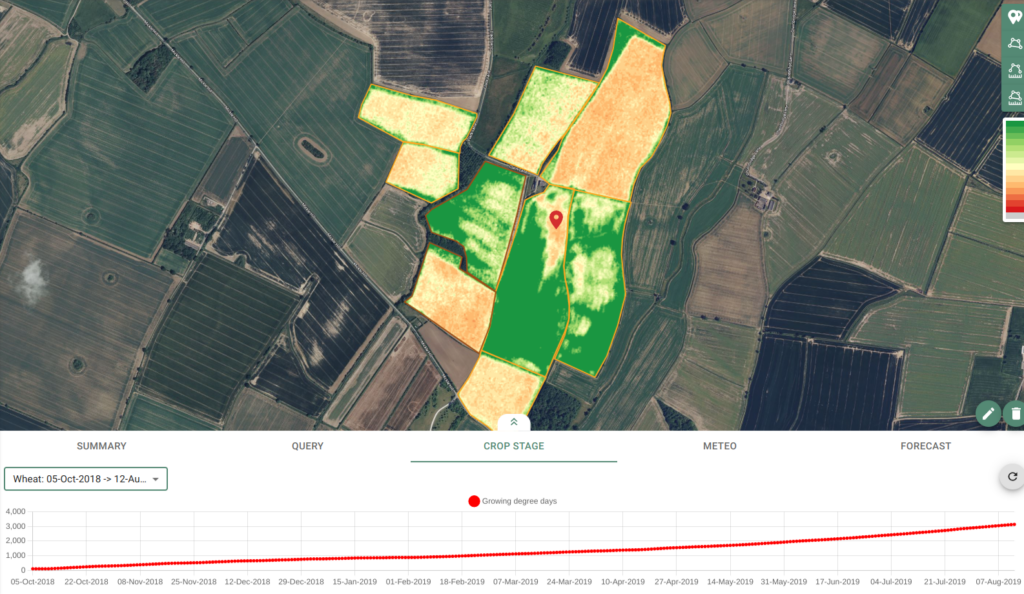
The sum of temperatures (GDD) is used to estimate the developmental stage of a crop within its phenological cycle.
croplab
croplab
croplab
croplab
croplab
croplab
Benefits
The possibility of assessing the stage of development of the crops in the fields. GDD enables the detection of favorable conditions for potential pests, and therefore earlier detection of possible threats from insects and weeds and a timely reaction. Based on the stage of crop development, it is possible to plan activities such as fertilization, harvesting, etc.
Optimization of fertilization
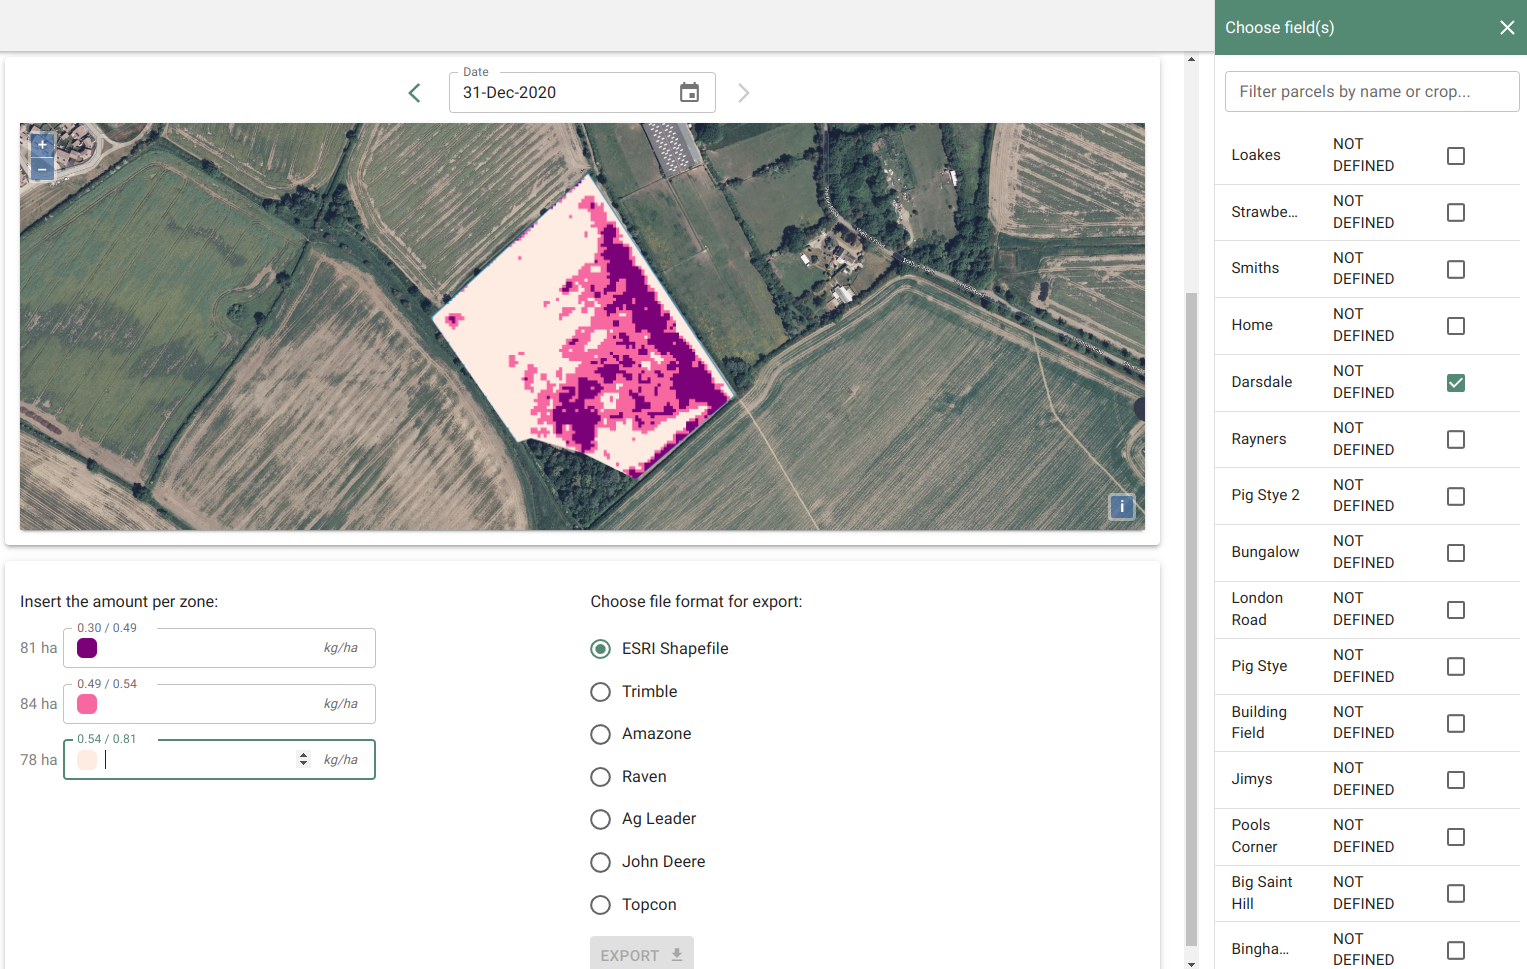
This service provides farmers with the opportunity to obtain a map for the application of variable treatments (such as fertilization or sowing) compatible with their machinery.
croplab
croplab
croplab
croplab
croplab
Benefits
Reduces the use of fertilizers and other agricultural inputs for crop treatment, thereby reducing costs and increasing profits.
The automation of the agricultural process leads to greater cost savings through increased production and efficiency:
1. Savings on fertilizers and chemicals;
2. Potential yield is increased thanks to more efficient fertilization and spraying based on actual crop needs;
3. Protection of the environment from excessive fertilization or chemical spraying.
sdfsdfsdf
sdfsdfsdf
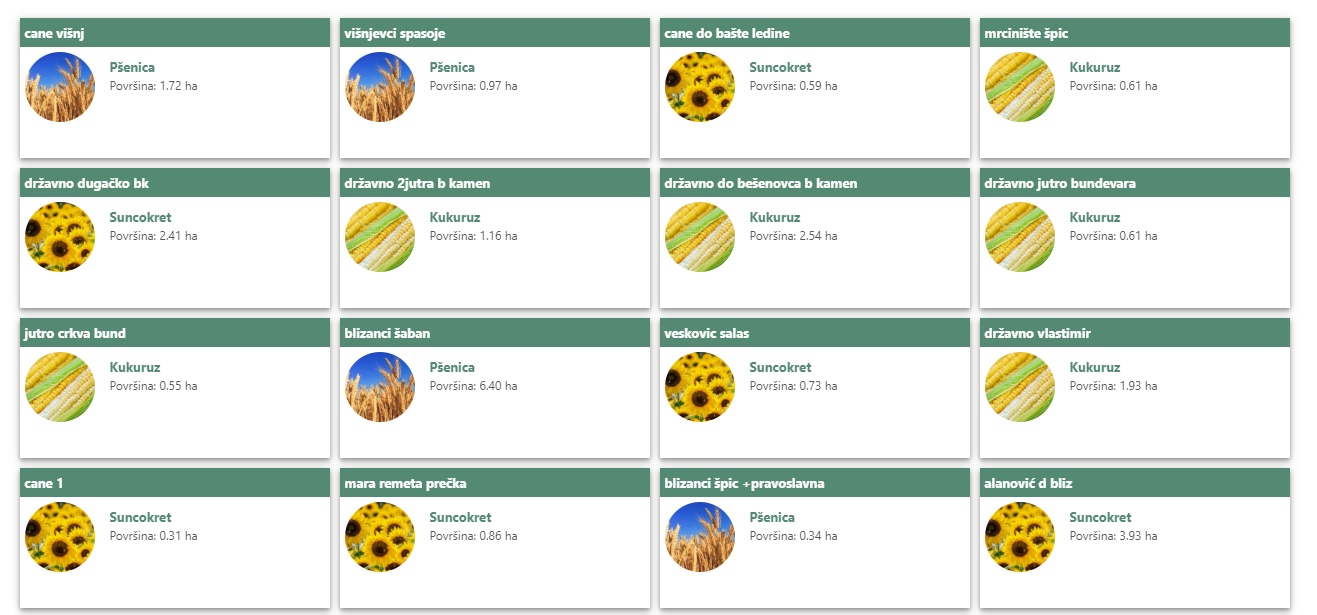
Field book
This service enables farmers to enter and manage activities (crops, variety, sowing date, fertilizer type, etc.) for each field in the system, as well as information about operators and supervisors. Data on activities are entered, work orders are sent to operators, executed activities are tracked, and reports are created to review and search all activities in the fields.
croplab
croplab
croplab
Benefits
CropLab provides farmers with the opportunity to easily add and store strategic data about their fields and crops in one place without the risk of loss or the obligation to keep this information in the form of papers and documents. The result is significant time savings and easy and quick access to all information at any time. Printing of all relevant report data for one or all fields is possible in PDF and Microsoft Excel format. Moreover, easy communication between farm managers is provided through the creation and forwarding of work orders, as well as tracking their status.
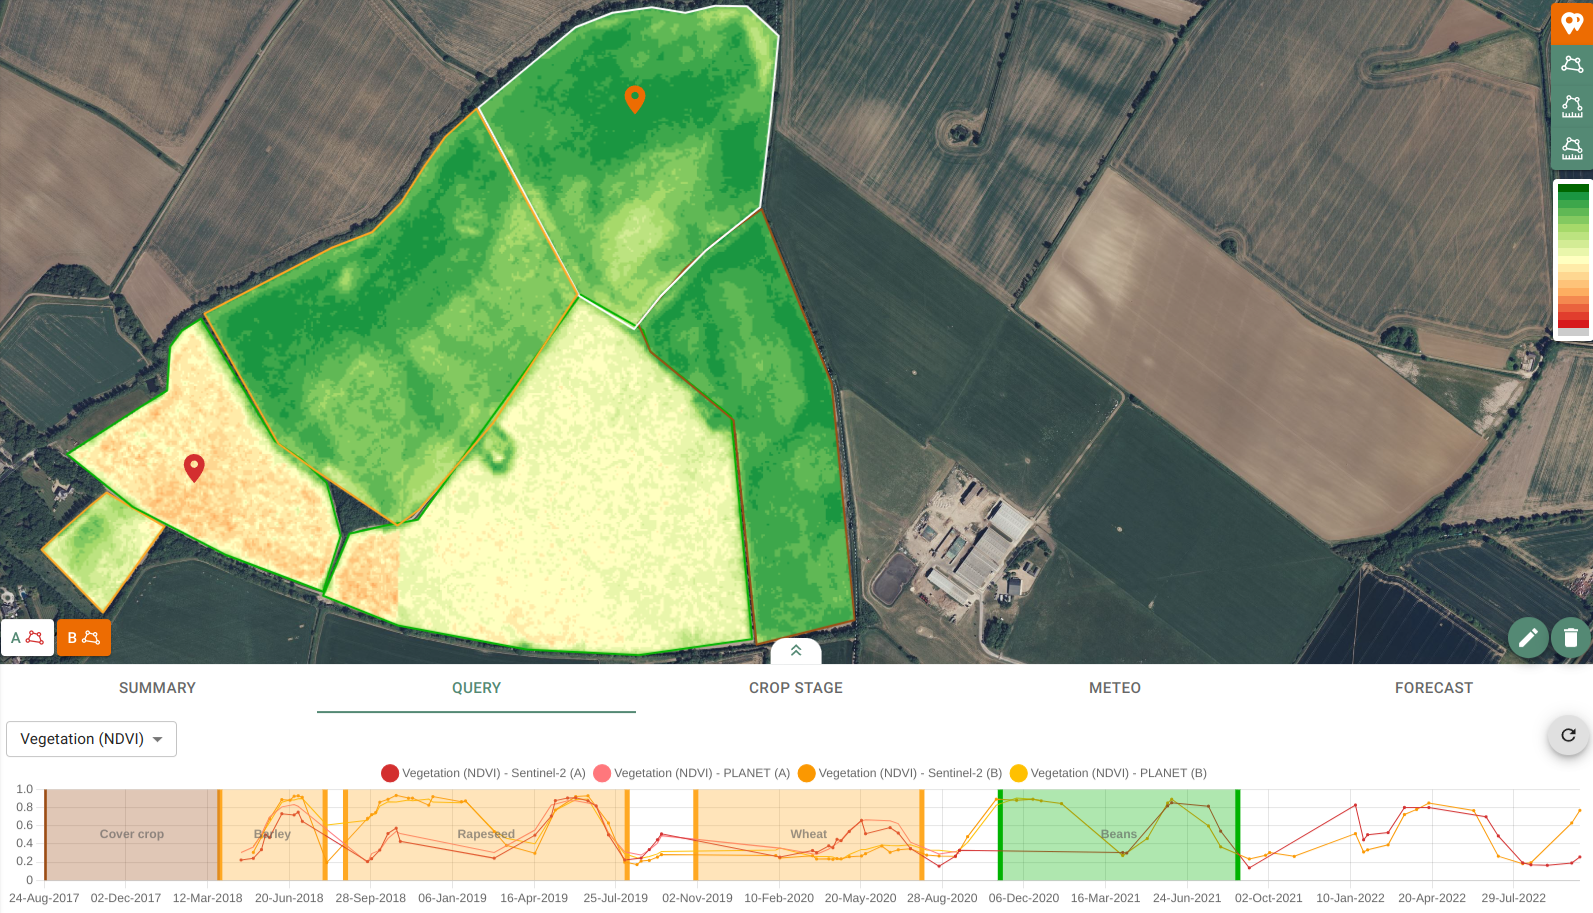
Compare two fields
This feature represents one of the most significant advantages of the CropLab platform. Users are able to easily compare key biophysical parameters of crops between different parts of the same field or between two fields.
croplab
croplab
croplab
croplab
croplab
Benefits
Analyzing crop behavior in different parts of a field or on different fields allows farmers to timely react to problems or develop targeted strategies for long-term production optimization.
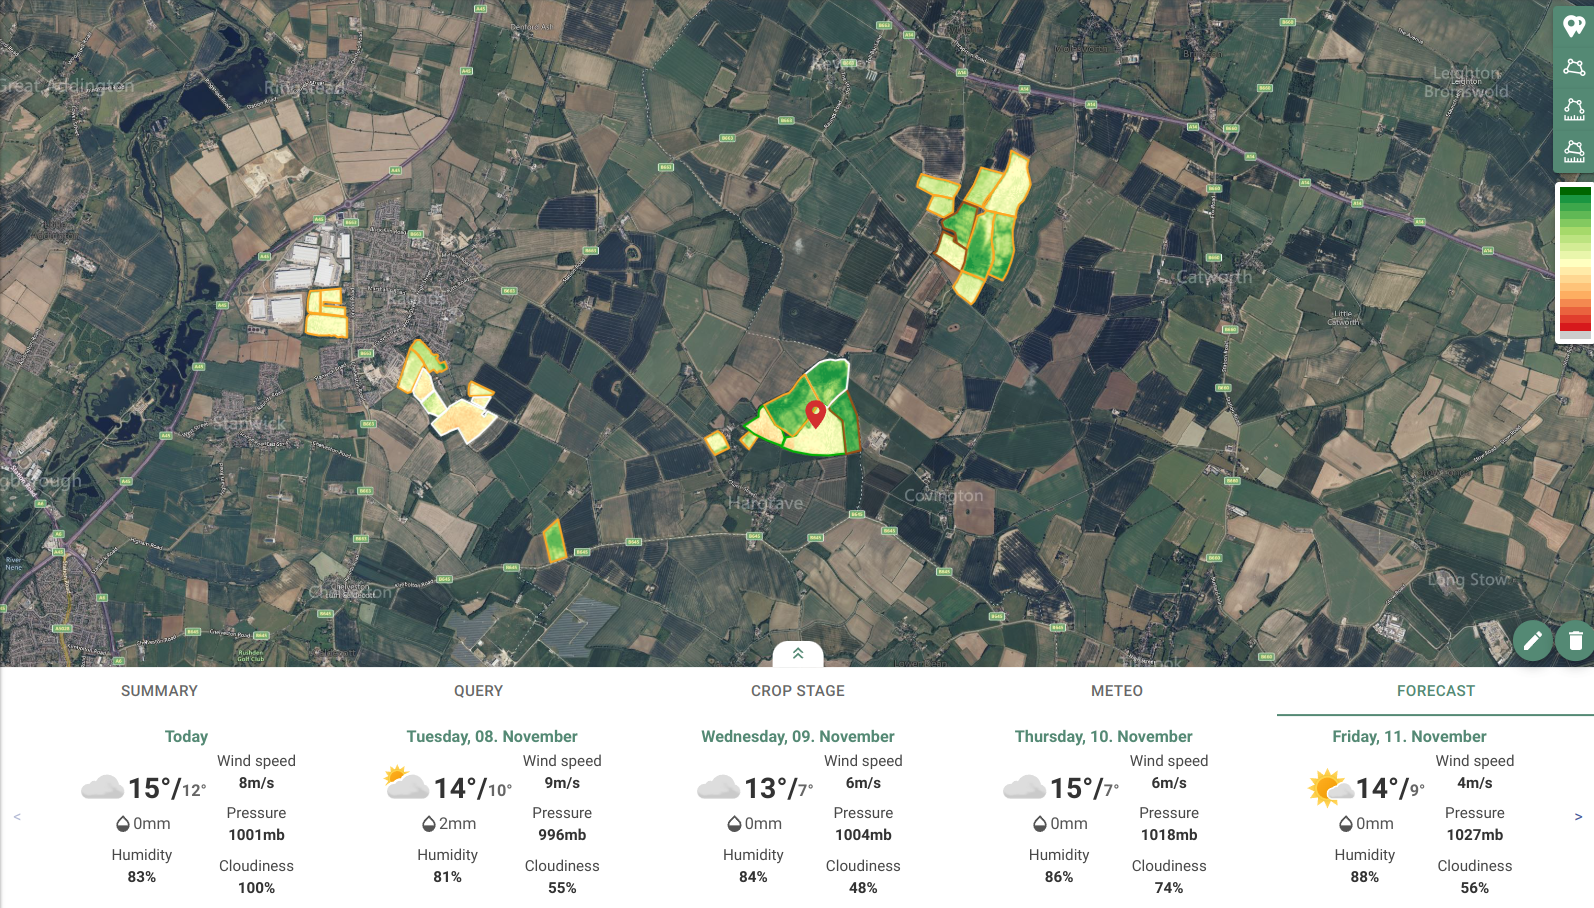
Weather forecast
CropLab provides information about current weather conditions on the field and a 10-day forecast, broken down by days and hours. The best forecasts from the Norwegian Meteorological Institute are used for this purpose.
croplab
croplab
croplab
croplab
Benefits
Accurate weather forecasting is crucial information for every farmer. It allows for better planning and organization of work on the fields that depend on weather conditions (such as plowing, planting, harvesting, watering, etc.).
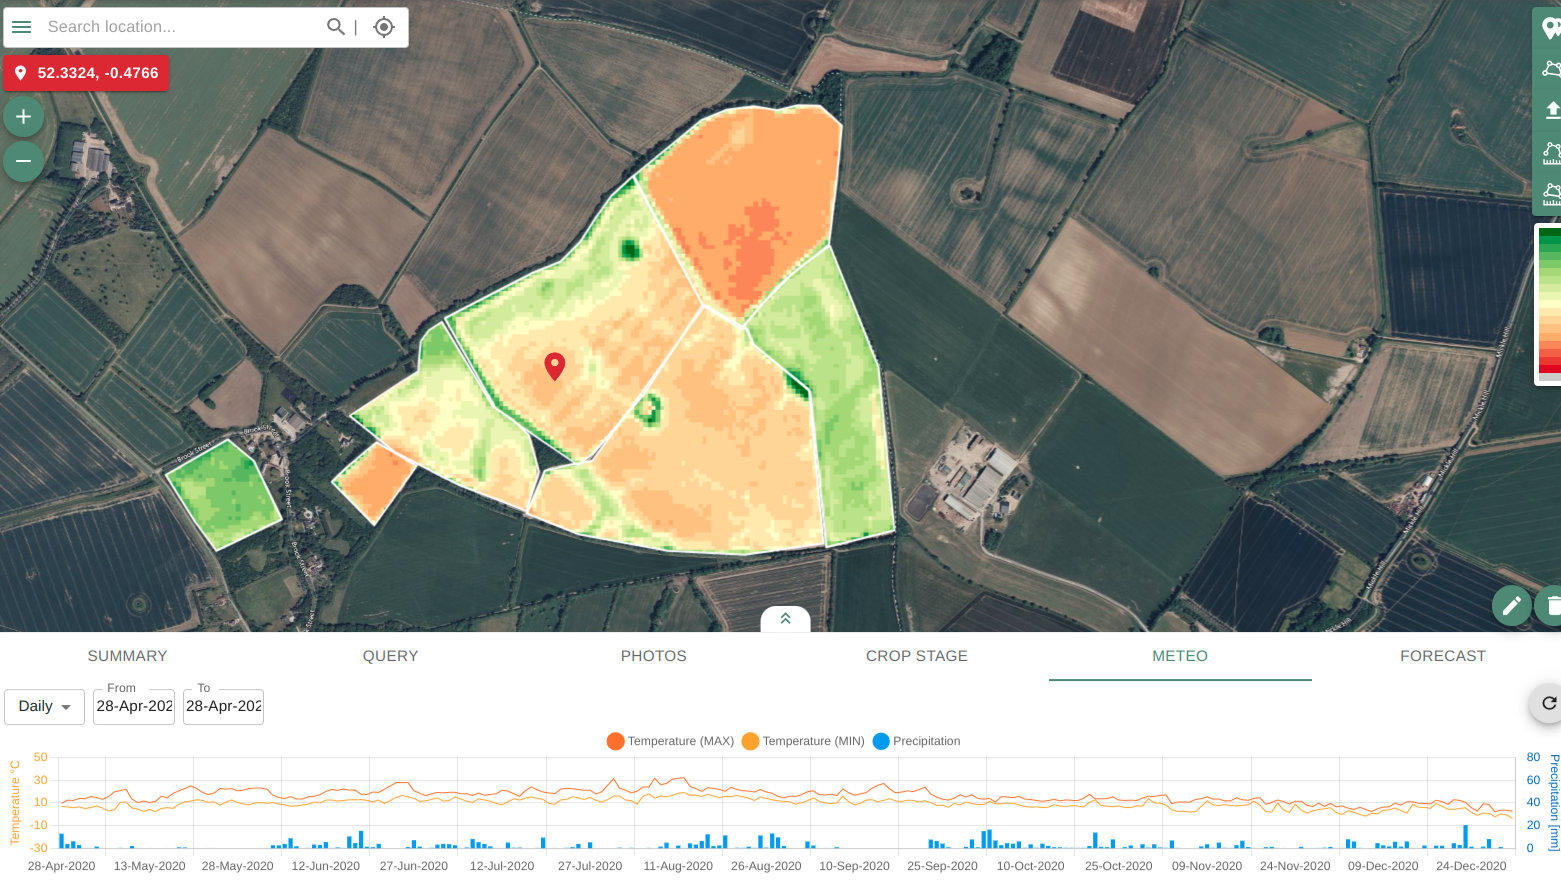
Historical weather data
CropLab provides access to historical meteorological data dating back to 2000 for all fields, including daily temperatures (maximum and minimum) and precipitation, as well as accumulated monthly precipitation.
croplab
croplab
croplab
croplab
Benefits
This service significantly facilitates the definition of future strategies on agricultural farms based on historical weather conditions. Farmers can combine their historical harvest data with meteorological data to better plan their future actions.
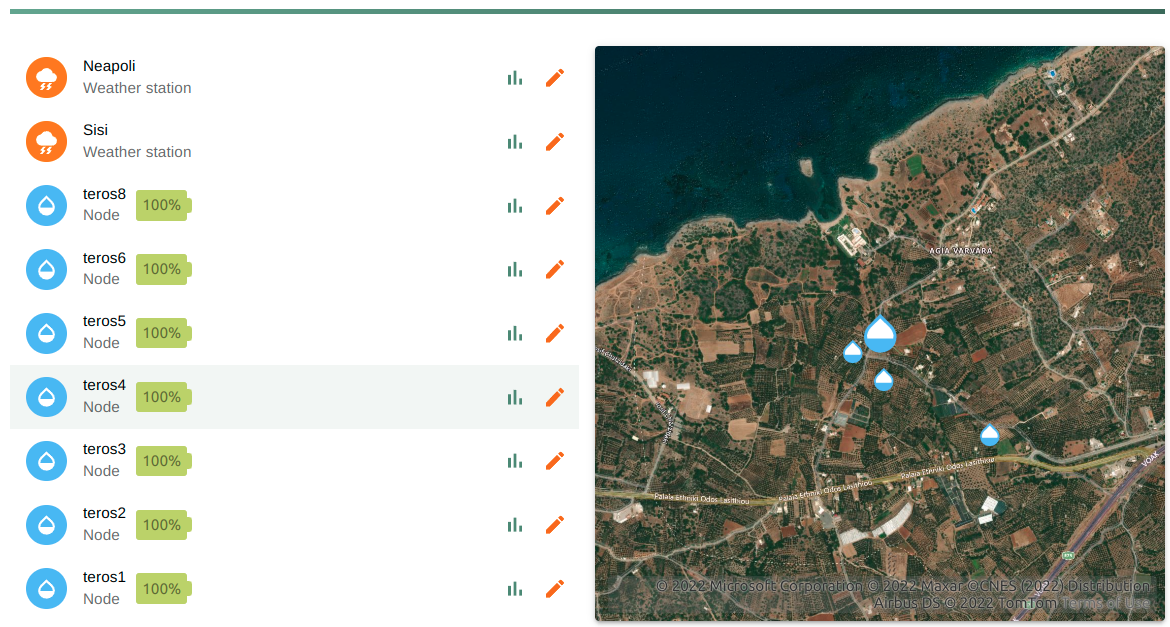
Sensors
This service enables the integration of sensors and monitoring of sensor measurements within the CropLab platform. .
croplab
croplab
croplab
croplab
croplab
croplab
croplab
croplab
croplab
croplab
croplab
croplab
croplab
croplab
Benefits
By using different sensors, variations in different climatic parameters (temperature, precipitation, humidity, wind, etc.) as well as soil parameters (moisture, electrical conductivity, composition, etc.) can be monitored. Observing these parameters indirectly allows monitoring of yield, soil fertility status, weed growth, disease development, and more. Together with the sensors, CropLab actually enables monitoring of microclimatic conditions in the field in real time, ultimately resulting in more economical production, significant savings in raw materials, and energy consumption.
croplab
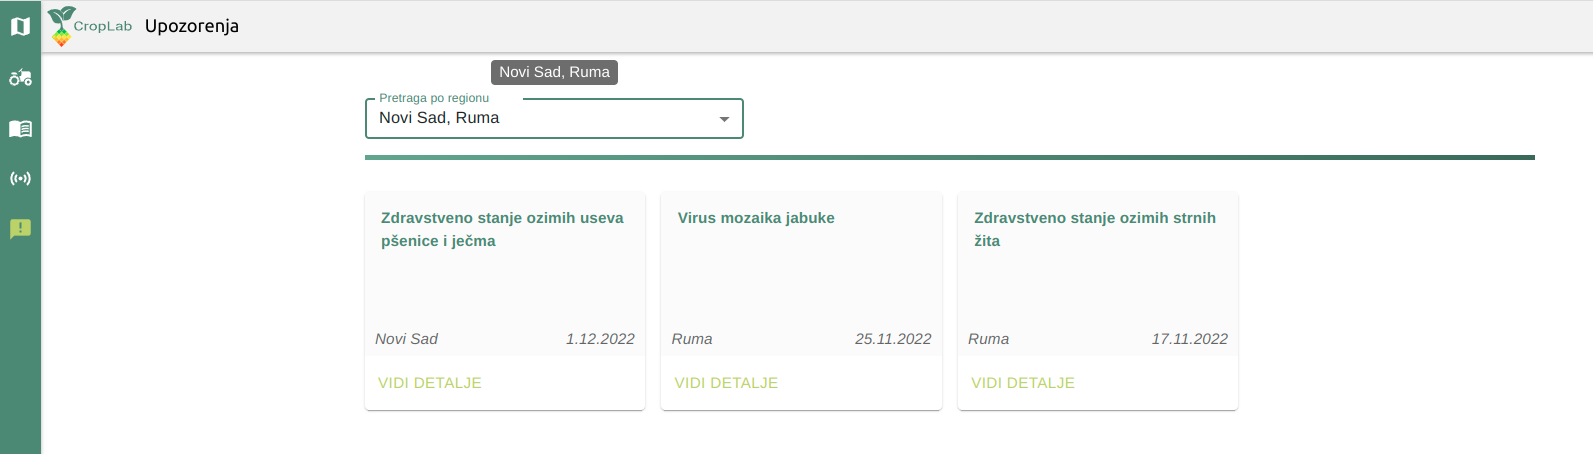
Alerts
For users whose fields are located in Serbia, CropLab provides notifications and direct access to information from the Plant Health Protection and Information Service (PIS), which deals with plant protection in Serbia. The goal of this service is to provide timely, accurate, and complete information to agricultural producers on the timing, dosage, and selection of preparations for plant disease and pest control.
croplab
croplab
croplab
croplab
croplab
Benefits
For all fields, users in Serbia can check PIS recommendations for their crops, according to the region in which their crop is located. Through this service, users can compare PIS recommendations with data on the plant protection methods they have implemented in the past few years. In this way, the user is provided with another form of validation for treating crops in their fields.
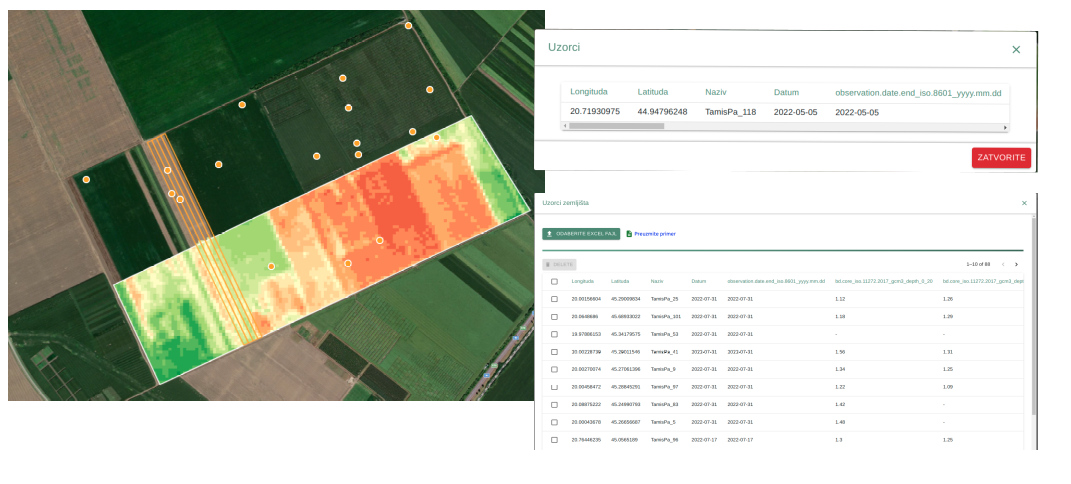
Soil sampling
The agrochemical soil analysis is a very important factor in successful agricultural production. By sampling and analyzing the soil, useful information is obtained about the current state of the soil and how to treat the soil in the future.
croplab
croplab
croplab
croplab
croplab
croplab
croplab
croplab
croplab
croplab
croplab
croplab
Benefits
This service provides easy integration of sampling results with all other field information in one place. Sampling data can be viewed on a map, for each individual sampling location, or in a table for all samples.
croplab
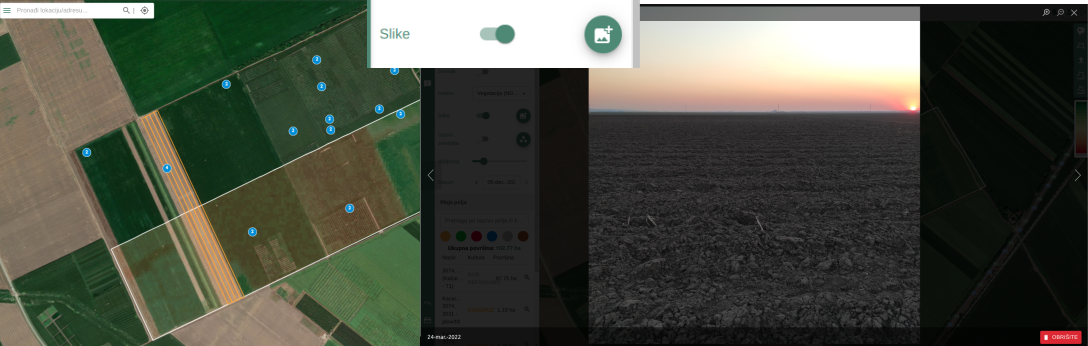
Geo-tagged photos
CropLab allows adding geo-tagged photos for each field. A geo-tagged photo is a photo saved with the location where it was taken. It is only necessary to add the geo-tagged photo and it will be displayed on the corresponding field.
croplab
croplab
croplab
croplab
croplab
croplab
croplab
croplab
croplab
croplab
Benefits
Photos taken with mobile phones that have location enabled have all the characteristics of a geo-tagged photo. Such photos that show activities and conditions in the fields can be stored and searched in one place within the CropLab platform.
Products
NDVI index
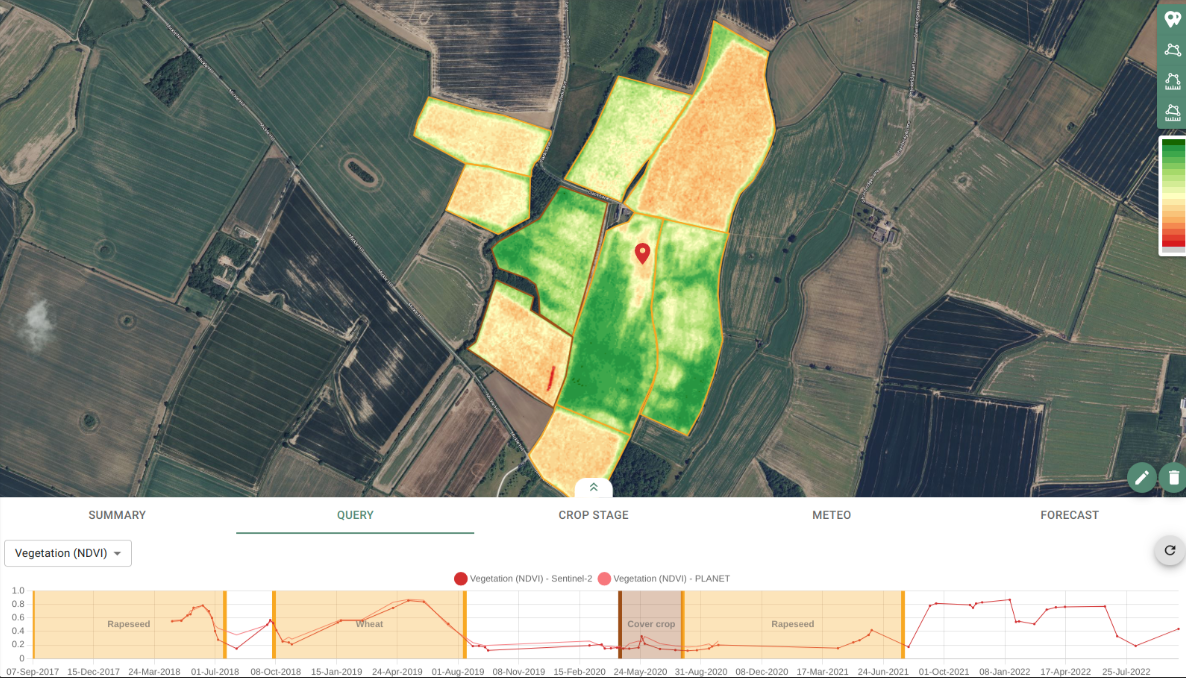
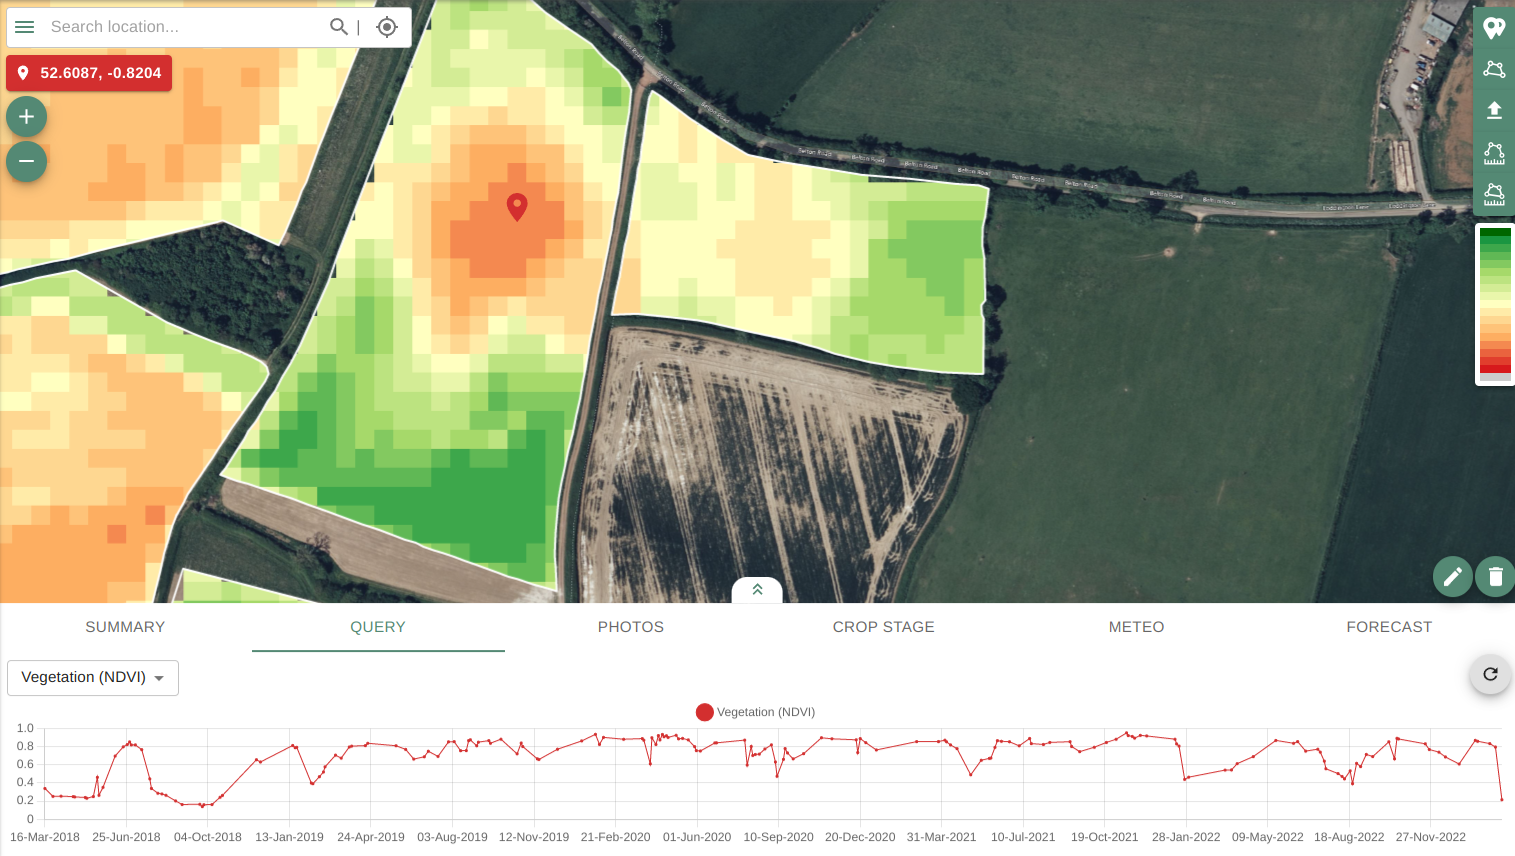
NDVI (Normalized Difference Vegetation Index) is a vegetation index of normalized difference in reflectance. It is the most popular index used to assess plant and crop health throughout the growing season by measuring the difference in spectral channels, the red channel (which vegetation absorbs – has a low value) and the near-infrared (NIR) channel (which vegetation reflects – has a high value in healthy vegetation). Changes in crops can be identified more quickly through the NIR channel than with the visible spectrum, allowing farmers to identify diseases, fungi, and drought conditions (up to two weeks earlier) and respond preventively. The NDVI value ranges from 0 to 1, where a value of around 0 indicates no green crops, while values close to 1 represent dense and healthy green crops.
In CropLab, the NDVI values of a given point are graphically displayed through a diagram at the bottom of the screen, and on the map, NDVI is displayed using specific colors (Image 4). The yellow color represents an NDVI value of around 0.5, shades of orange and red depict lower NDVI values from 0.45 (to 0), while shades of green represent NDVI values greater than 0.5 (up to 1).
CHL index
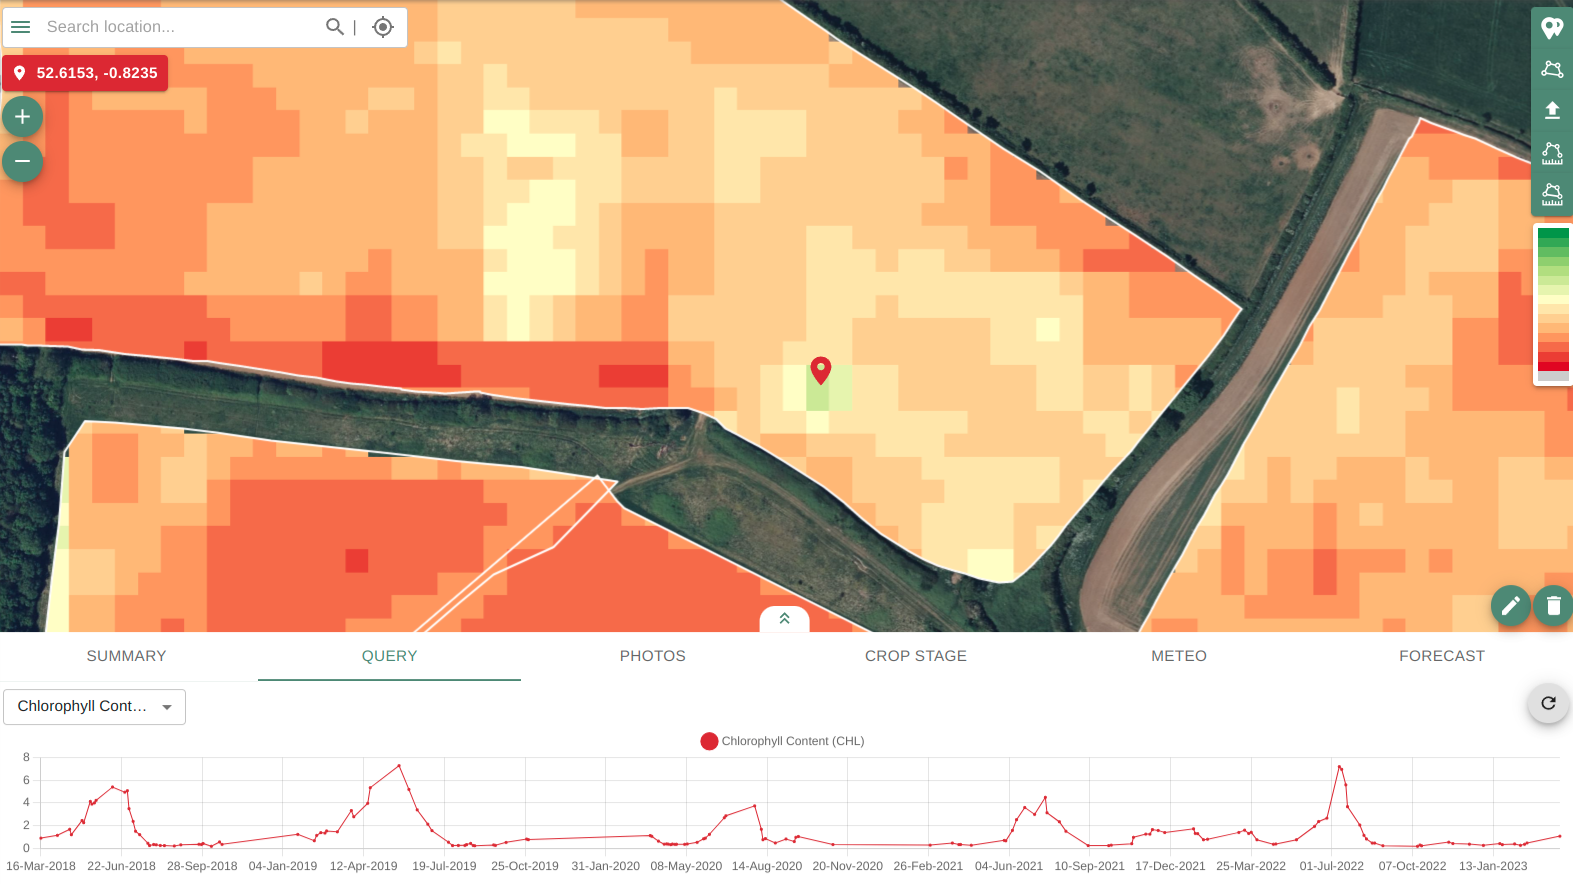
Leaf chlorophyll content – CHL indicates the photosynthetic activity related to the concentration of nitrogen in green vegetation and serves as a measure of crop response to nitrogen application. It is used as an indirect sign of nitrogen levels in fertilization management. Chlorophyll parameter allows farmers/agronomists to detect diseases before they become visible in the field. Early disease detection enables farmers to stop its spread. Compared to the other four biophysical parameters in CropLab, CHL is the most innovative parameter and its application and usefulness are increasing.
In the CropLab platform, chlorophyll values for a particular point are graphically displayed on the diagram at the bottom of the workspace, and these values are also shown on the map using colors ranging from red (no chlorophyll content) to yellow, to dark green (highest chlorophyll content) – see the image.
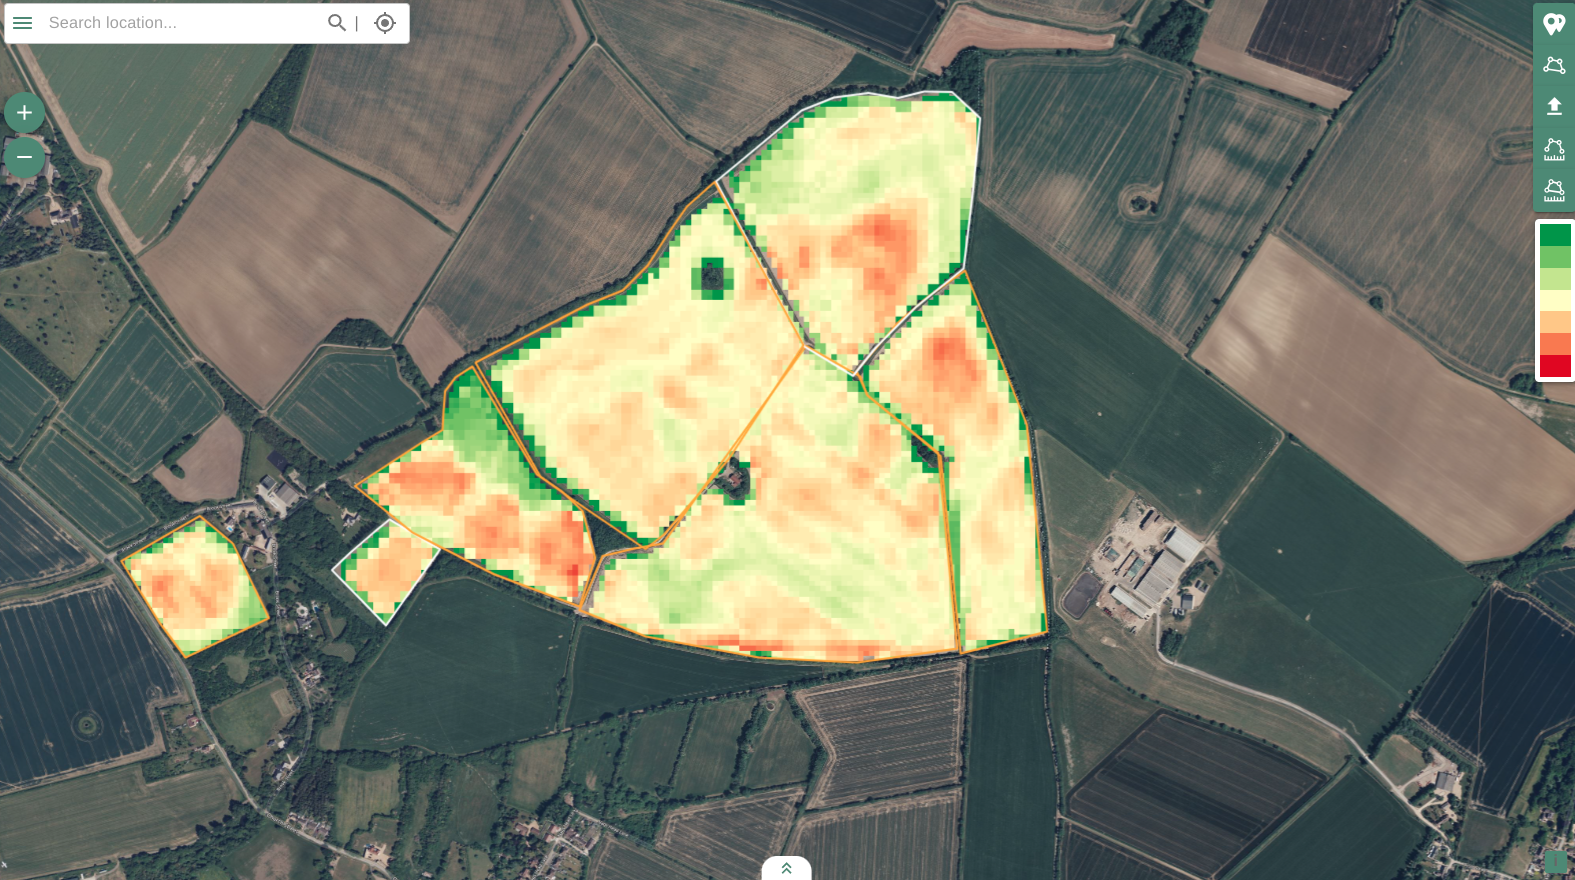
Productivity
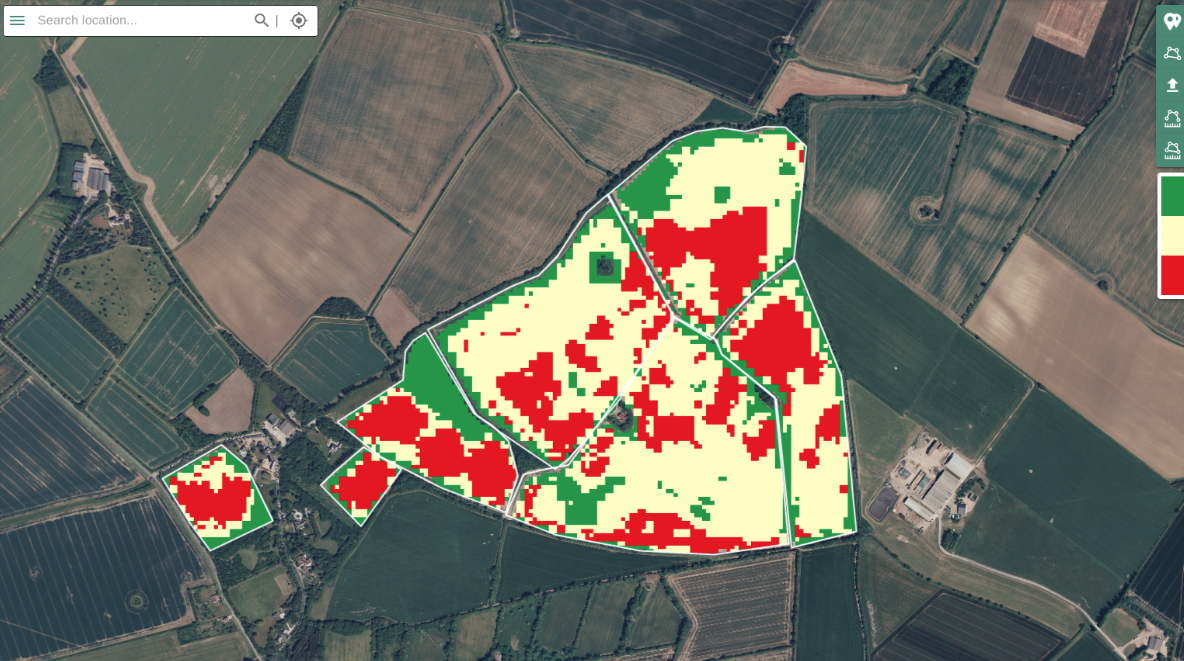
Productivity is a product based on a long-term time series of satellite images. The productivity map represents the percentage deviation (positive or negative) of NDVI of any location within the field from the average NDVI value for the entire field. The productivity map is displayed on the CropLab platform with colors ranging from red (30% lower productivity than the field average), through yellow (productivity is around the field average), to dark green (30% higher productivity than the field average). Since the information on productivity is related to a specific field (productivity values are shown relative to the average value in the field), it is not possible to compare productivity maps of multiple fields.
Since most fields are not equally productive across their entire surface, the productivity service helps farmers determine which parts of the field are less or more productive, enabling them to develop more precise field management strategies and achieve maximum yield. This is also a very useful service for analyzing new fields. Farmers can identify areas of different shapes in the field whose yield was lower in previous seasons compared to the rest of the field.
Management zone
Management zones provide information about parts of a field where crops are performing better, worse, or average compared to the field’s average, and to what extent. This information is based on productivity. Management zones are separate parts of the field that should be treated differently, i.e., applying different amounts of products/materials (e.g., fertilizers). When using variable rate technology for precision agriculture, it is important to determine which zones farmers or machines should apply certain products/materials to. Otherwise, crops may grow unevenly, leading to lower average quality and yield. Properly determining management zones is the first step in fertilization. Each zone will receive a different amount of fertilizer depending on the type and composition of the soil, terrain, and previous production. CropLab allows automatic definition of three management zones in fields based on productivity based on biophysical parameters obtained from Sentinel data.
This service enables standardization and maximization of crop quality in the field by applying different amounts of inputs (e.g., mineral fertilizers, herbicides, seeds). This will ensure cost reduction and maximize input efficiency (proper choice of hybrids based on soil fertility information, scattering of mineral fertilizers, reduced use of plant protection products, reduced fuel consumption, and finally reduced soil compaction), as well as more sustainable land management.
Tutorials
Introducing the basic features of CropLab platform:
Registration and basic profile settings:
Drawing and uploading fields in a few simple steps:
Basic field information:
Variable rate application:
Field book:
Pricing
< 100 hectares total area
Free
>100 hectares total area
Contact Us
Contact
Contact us and we will get back to you as soon as possible.
94 Dragoslava Srejovića, Belgrade, Srbija
info@croplab.info